Spring 2026
Ultrasonic Sensor
Demo
See it in action
Objective
Measuring an oscillating mass without touching it
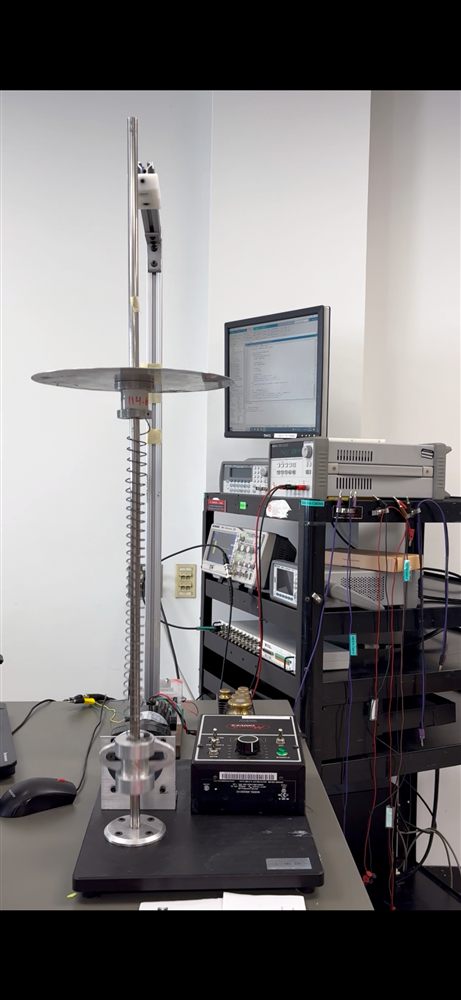
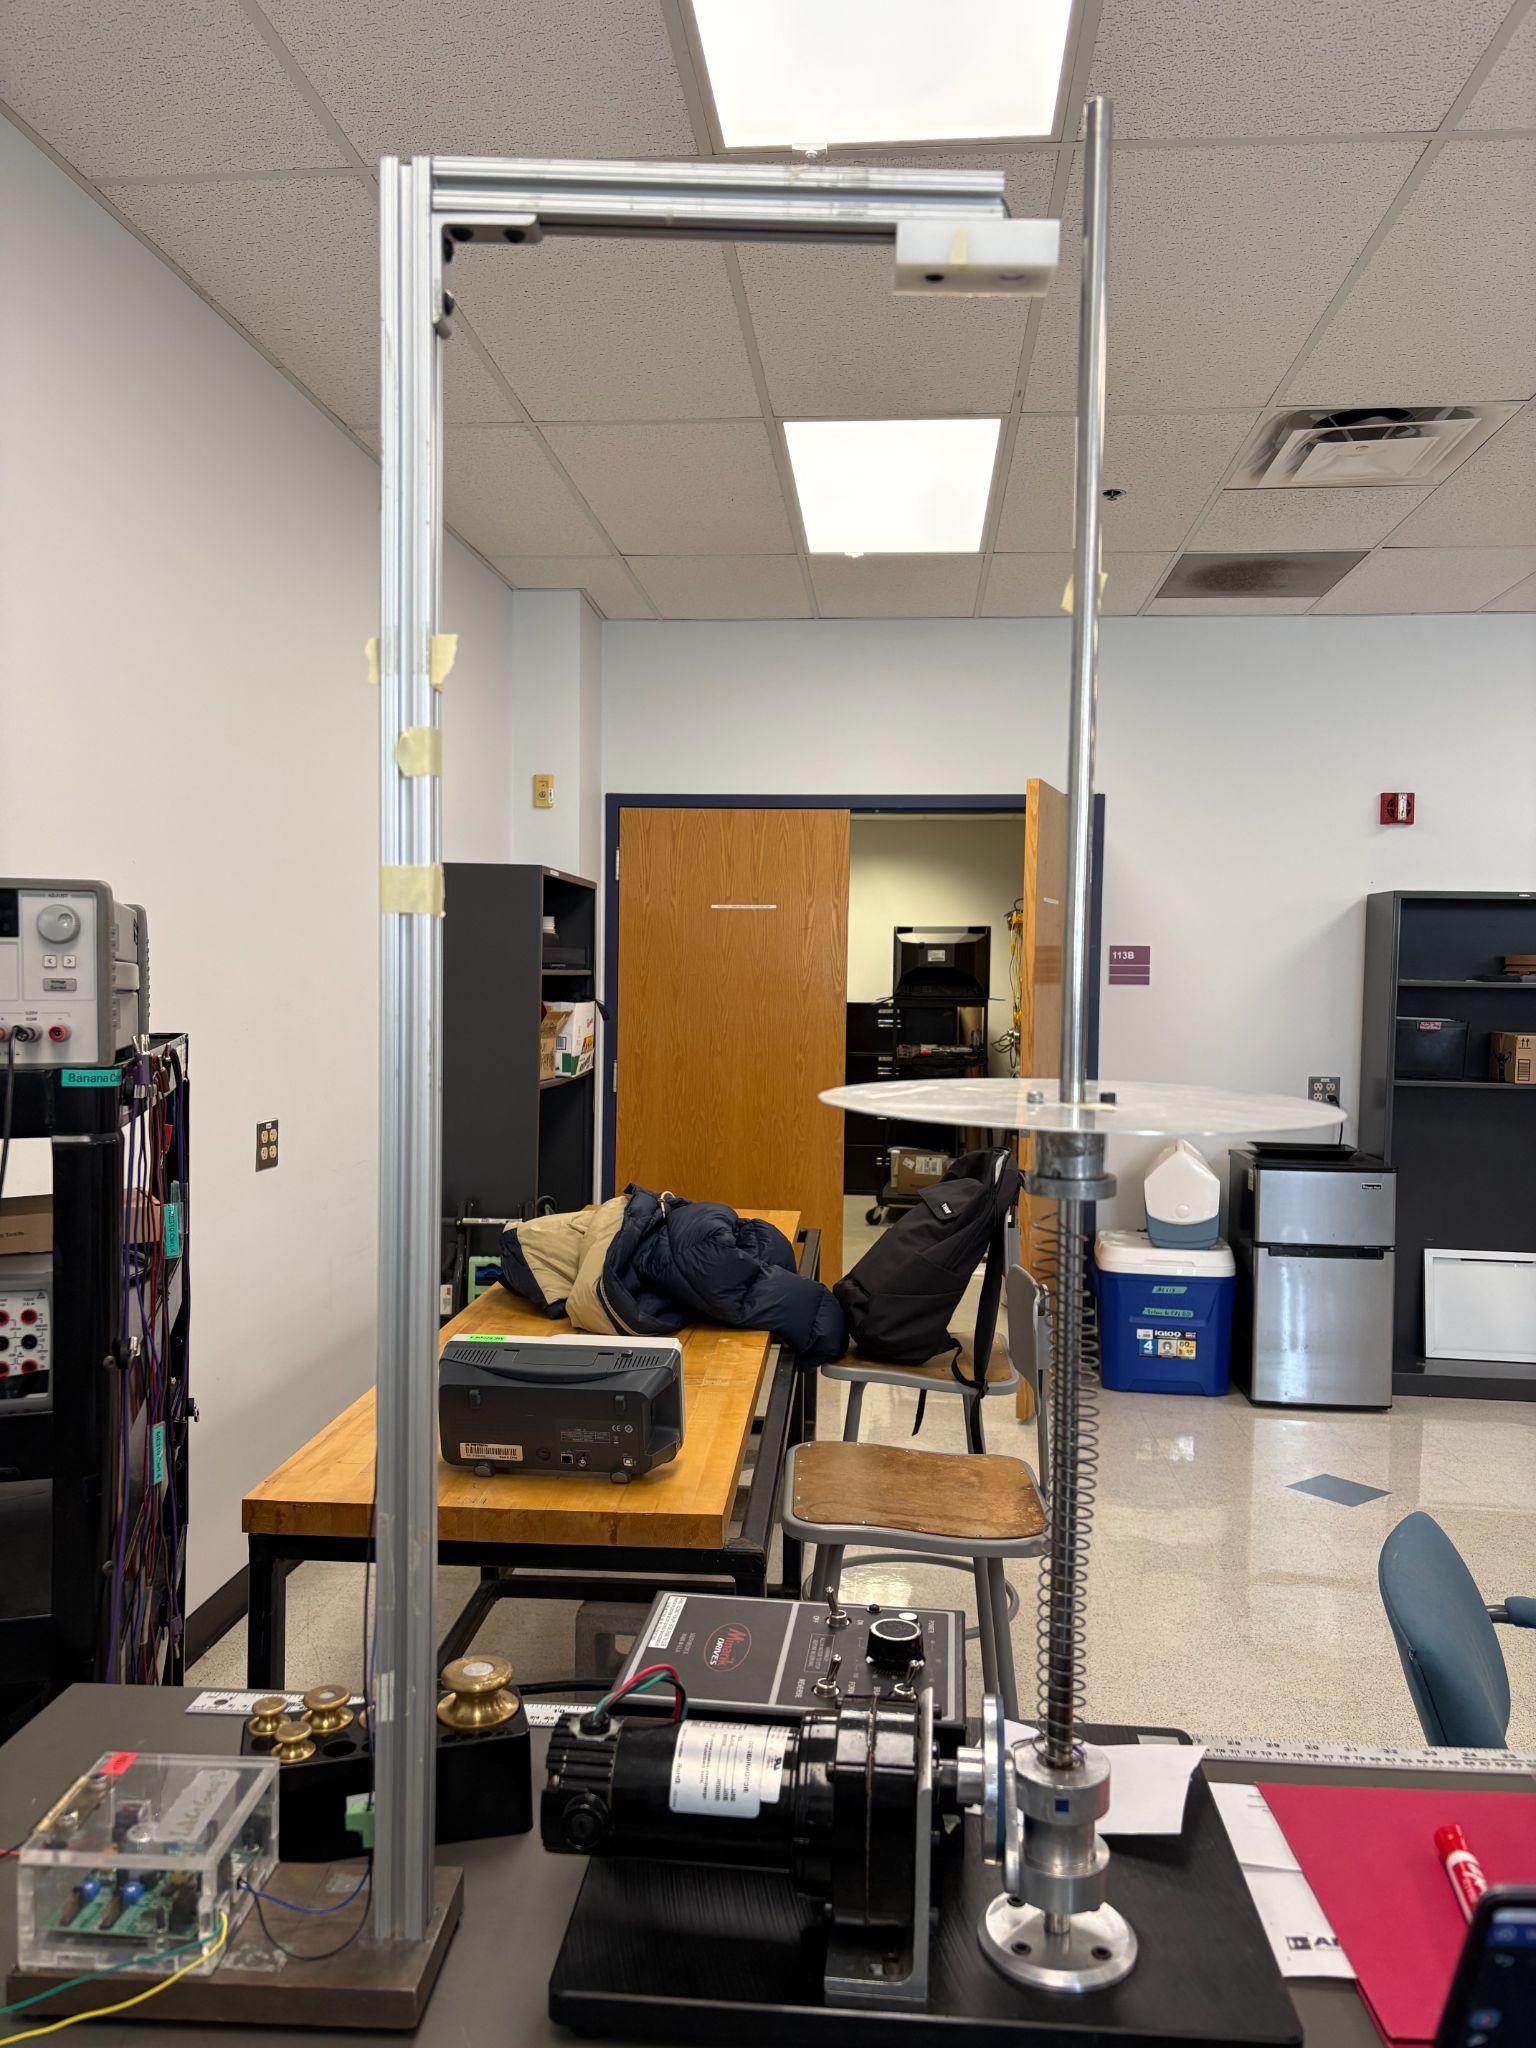
ME310 is BU's instrumentation course, and the final project dropped four of us into a group with one job: track the motion of a vibrating mass using nothing but sound. The rig is a weight on a spring, a collar and plate weighing 114.6 g sitting on top, with a motor that shakes the base through an adjustable knob. An ultrasonic sensor on an aluminum frame looks straight down at the collar and measures how far away it is, over and over, as it bounces.
Any spring-and-weight system has two numbers that describe how it moves: the rate it bounces at on its own once you let go, called the natural frequency, and how fast that bouncing dies out, called the damping ratio. We had to measure both, and to trust the answers we found each one two separate ways. Then we swept the motor from well below the natural frequency to well above it, mapped how hard the collar swung at each speed, and checked the whole picture against the standard spring-mass-damper equation.
Sensor choice
Why we measured with sound
The sensor is an AirMar AT-200, working at about 200 kHz, far above anything you can hear. We chose it over the other instruments in the lab for three reasons.
It never touches the collar. A contact sensor like the lab's spring-loaded wire potentiometer would tug on the collar as it moved, adding friction and drag and changing the very motion we were trying to record. Sound touches nothing.
It measures position directly. An accelerometer measures acceleration, and getting position back out of that means integrating twice, with each step letting a small offset grow into drift. The ultrasonic sensor just reports distance.
It needs no calibration. The distance comes from the speed of sound and a measured time, not from a voltage-to-distance curve we would have to build for every setup.
Signal processing
From pulse and echo to a distance
The sensor measures distance the way a bat does, by timing an echo. It fires a short click of ultrasound, the click bounces off the collar, and the sensor listens for it to return. Half the round-trip time, times the speed of sound (about 343 m/s in a room-temperature lab), is the distance: d = cΔt / 2. On the oscilloscope the two events are easy to see, a tall spike as the click goes out and a smaller one as the echo comes back. Sliding the collar by hand slides that second spike across the screen.
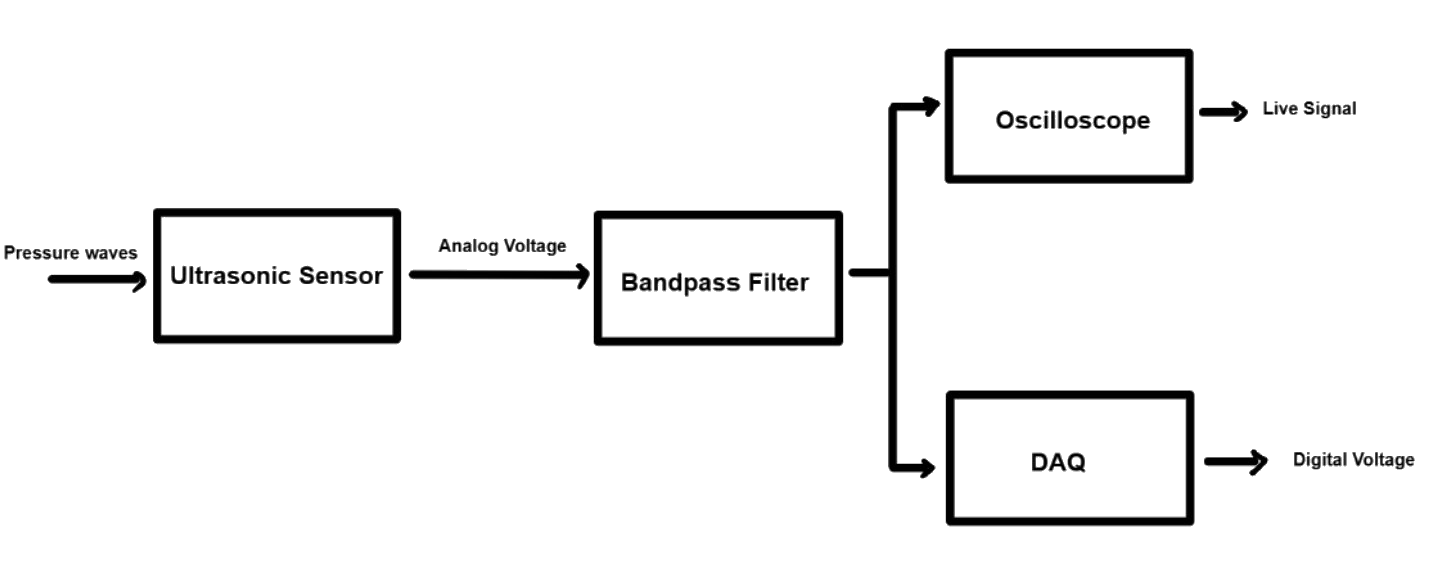
To keep the signal clean we ran it through a Krohn-Hite bandpass filter set to pass 190 to 210 kHz, a narrow window around the sensor's band, then split it with a T connector to the oscilloscope for a live view and to a National Instruments DAQ logging at 50 kHz. A MATLAB script we adapted picks the outgoing spike and the echo spike out of every cycle, measures the time between them, and turns it into a collar position. Run the motor and those positions trace a clean sine wave.
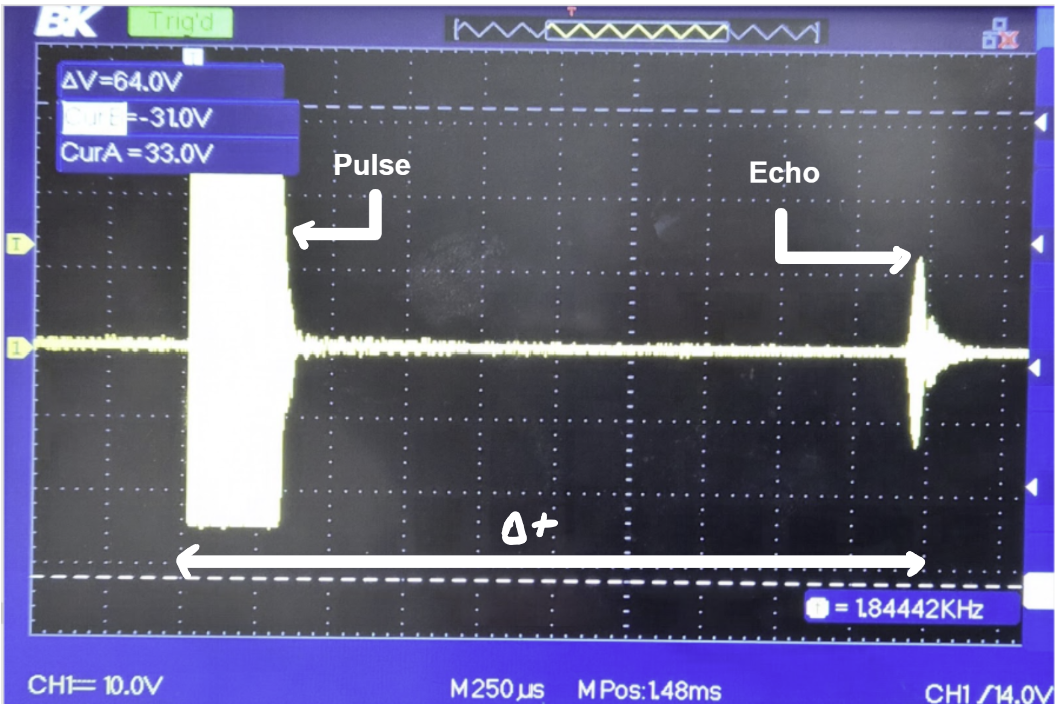
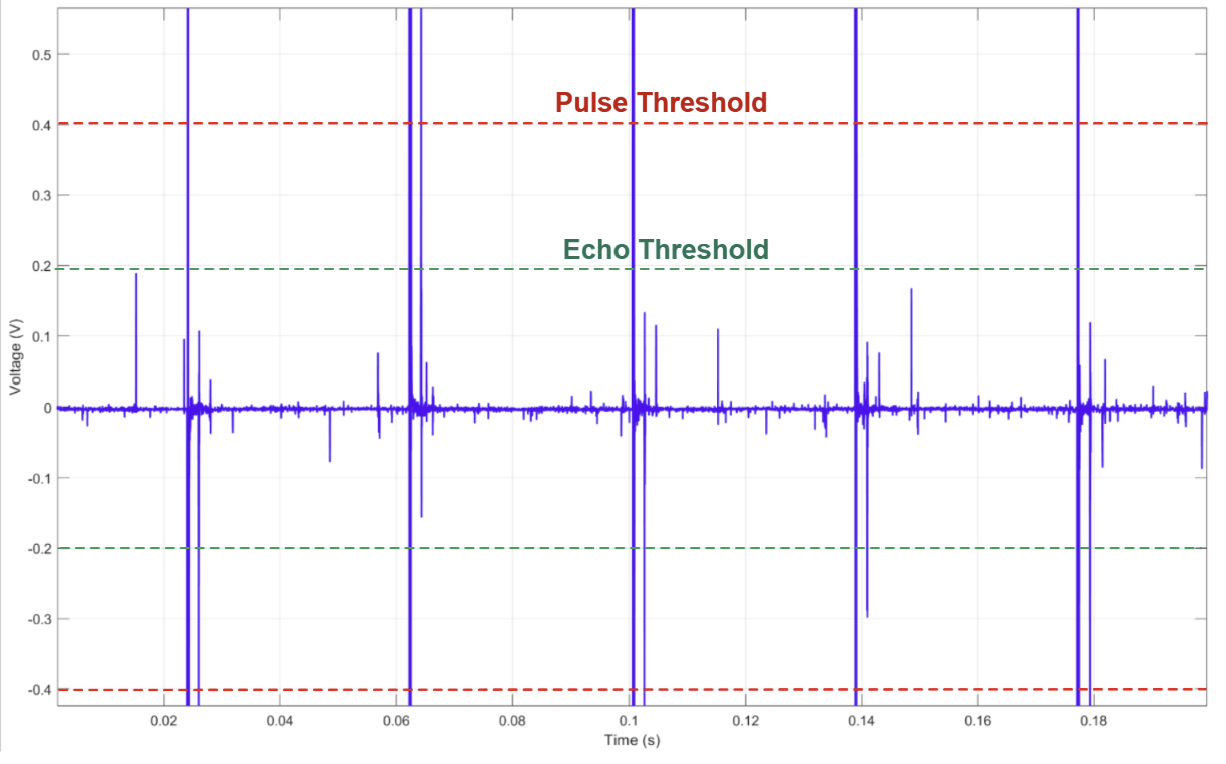
Left: the outgoing pulse and its echo on the scope, with the time gap Δt between them. Right: the raw recorded voltage, where the script keeps only the spikes tall enough to count and ignores the noise between them.
Parameters
Pinning down the spring, and two answers for the natural frequency
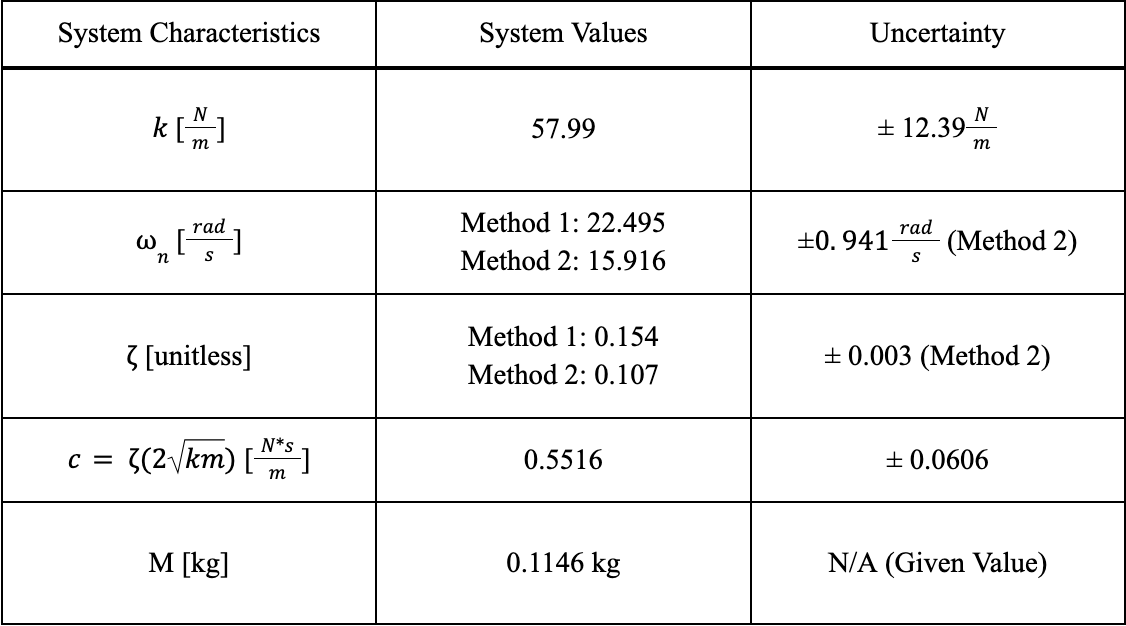
Everything downstream depends on the spring's stiffness, so we measured that first. We stacked known weights on the collar, from 200 g up to 1500 g, and recorded how far the spring squashed under each. Stiffness is force divided by compression. It averaged 58.0 N/m, but it was not constant: about 41 N/m under the lightest load and 76 N/m under the heaviest. The spring gets stiffer the harder you press it. That small nonlinearity comes back to bite us later.
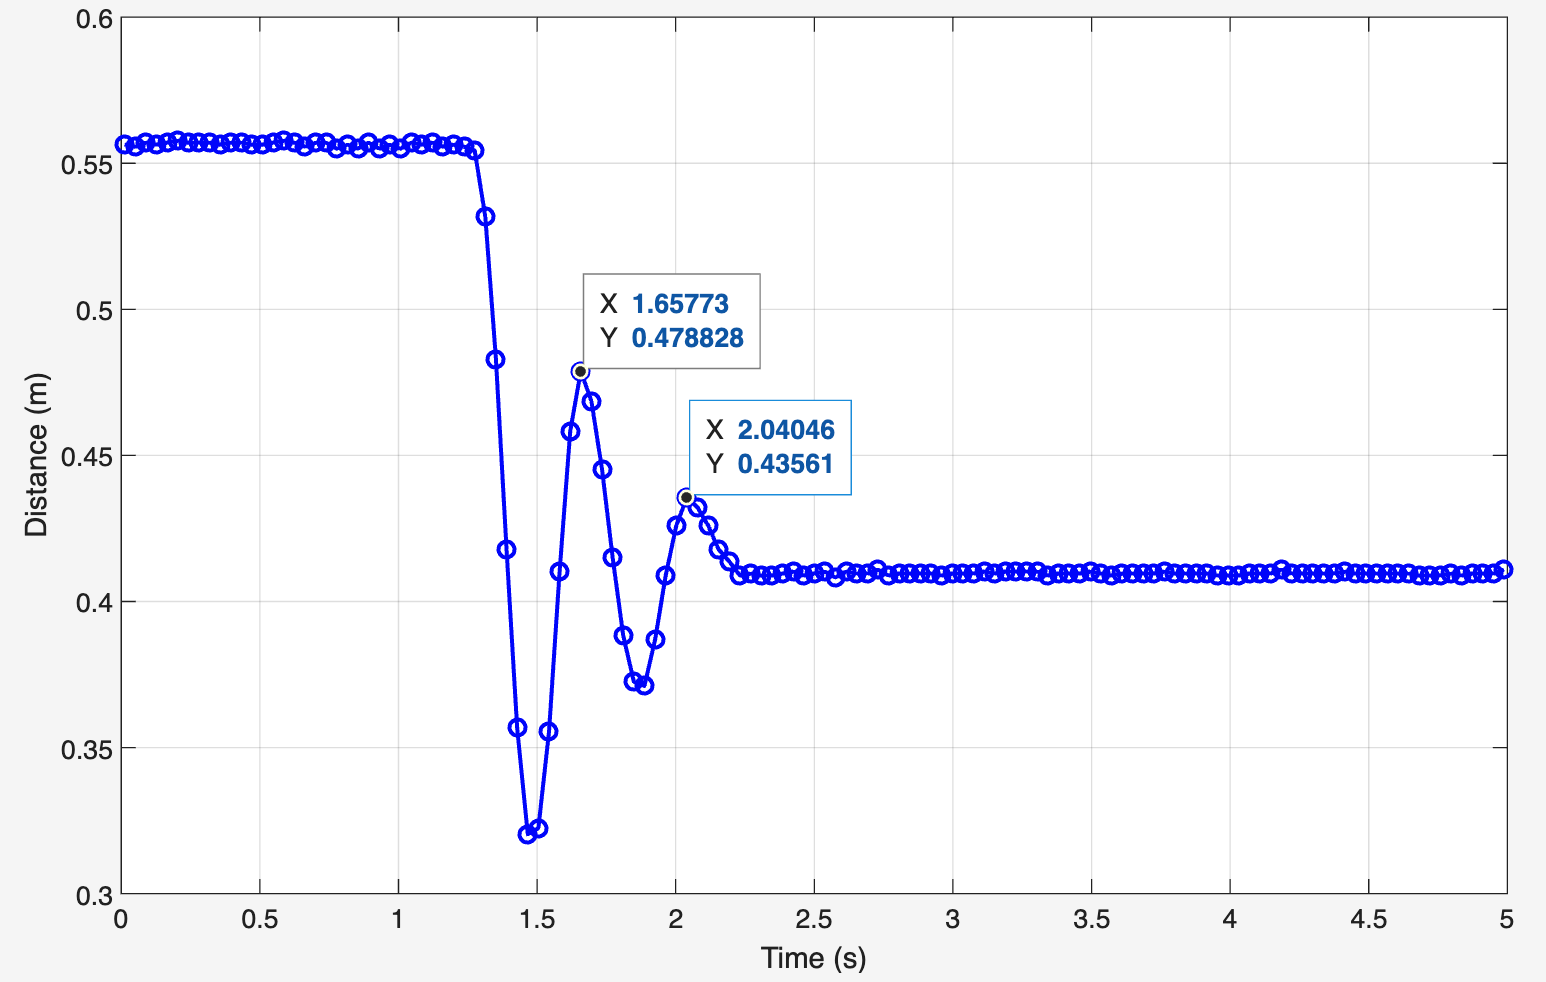
The natural frequency, the rate the collar bounces on its own, we found two ways. The textbook formula, ωn = √(k/m), gave 22.5 rad/s, or 3.58 Hz. The second method reads it off the experiment: find the shake speed that made the collar swing the most (knob setting 44), then correct that peak for damping, which gave 15.9 rad/s, or 2.53 Hz. The two answers differ by 29 percent, and we trusted the second. The textbook number leaned on stiffness measured under heavy static loads, where the spring is stiffest; in motion the light collar barely compresses it, so the spring in play is softer. A third check, taken from how the collar coasted to rest, landed at 16.5 rad/s, within about one percent of the second method.
Damping
Two reads on the damping
Damping, how quickly the bouncing fades, got the same two-method treatment. The first is the logarithmic decrement: switch the motor off, push the collar down, let go, and watch the swings shrink. How fast they shrink from one peak to the next fixes the damping, here ζ = 0.154. The second is the peak magnitude method: at resonance, the height of the response peak by itself pins the damping down, and that gave ζ = 0.107 with much tighter error bars, so that is the number we carried forward. A lower value also makes sense. In a fast, steady resonance the stick-slip friction in the collar's bearings drags on the motion less than it does during a slow, hand-released decay.
Frequency sweep
Sweeping through resonance
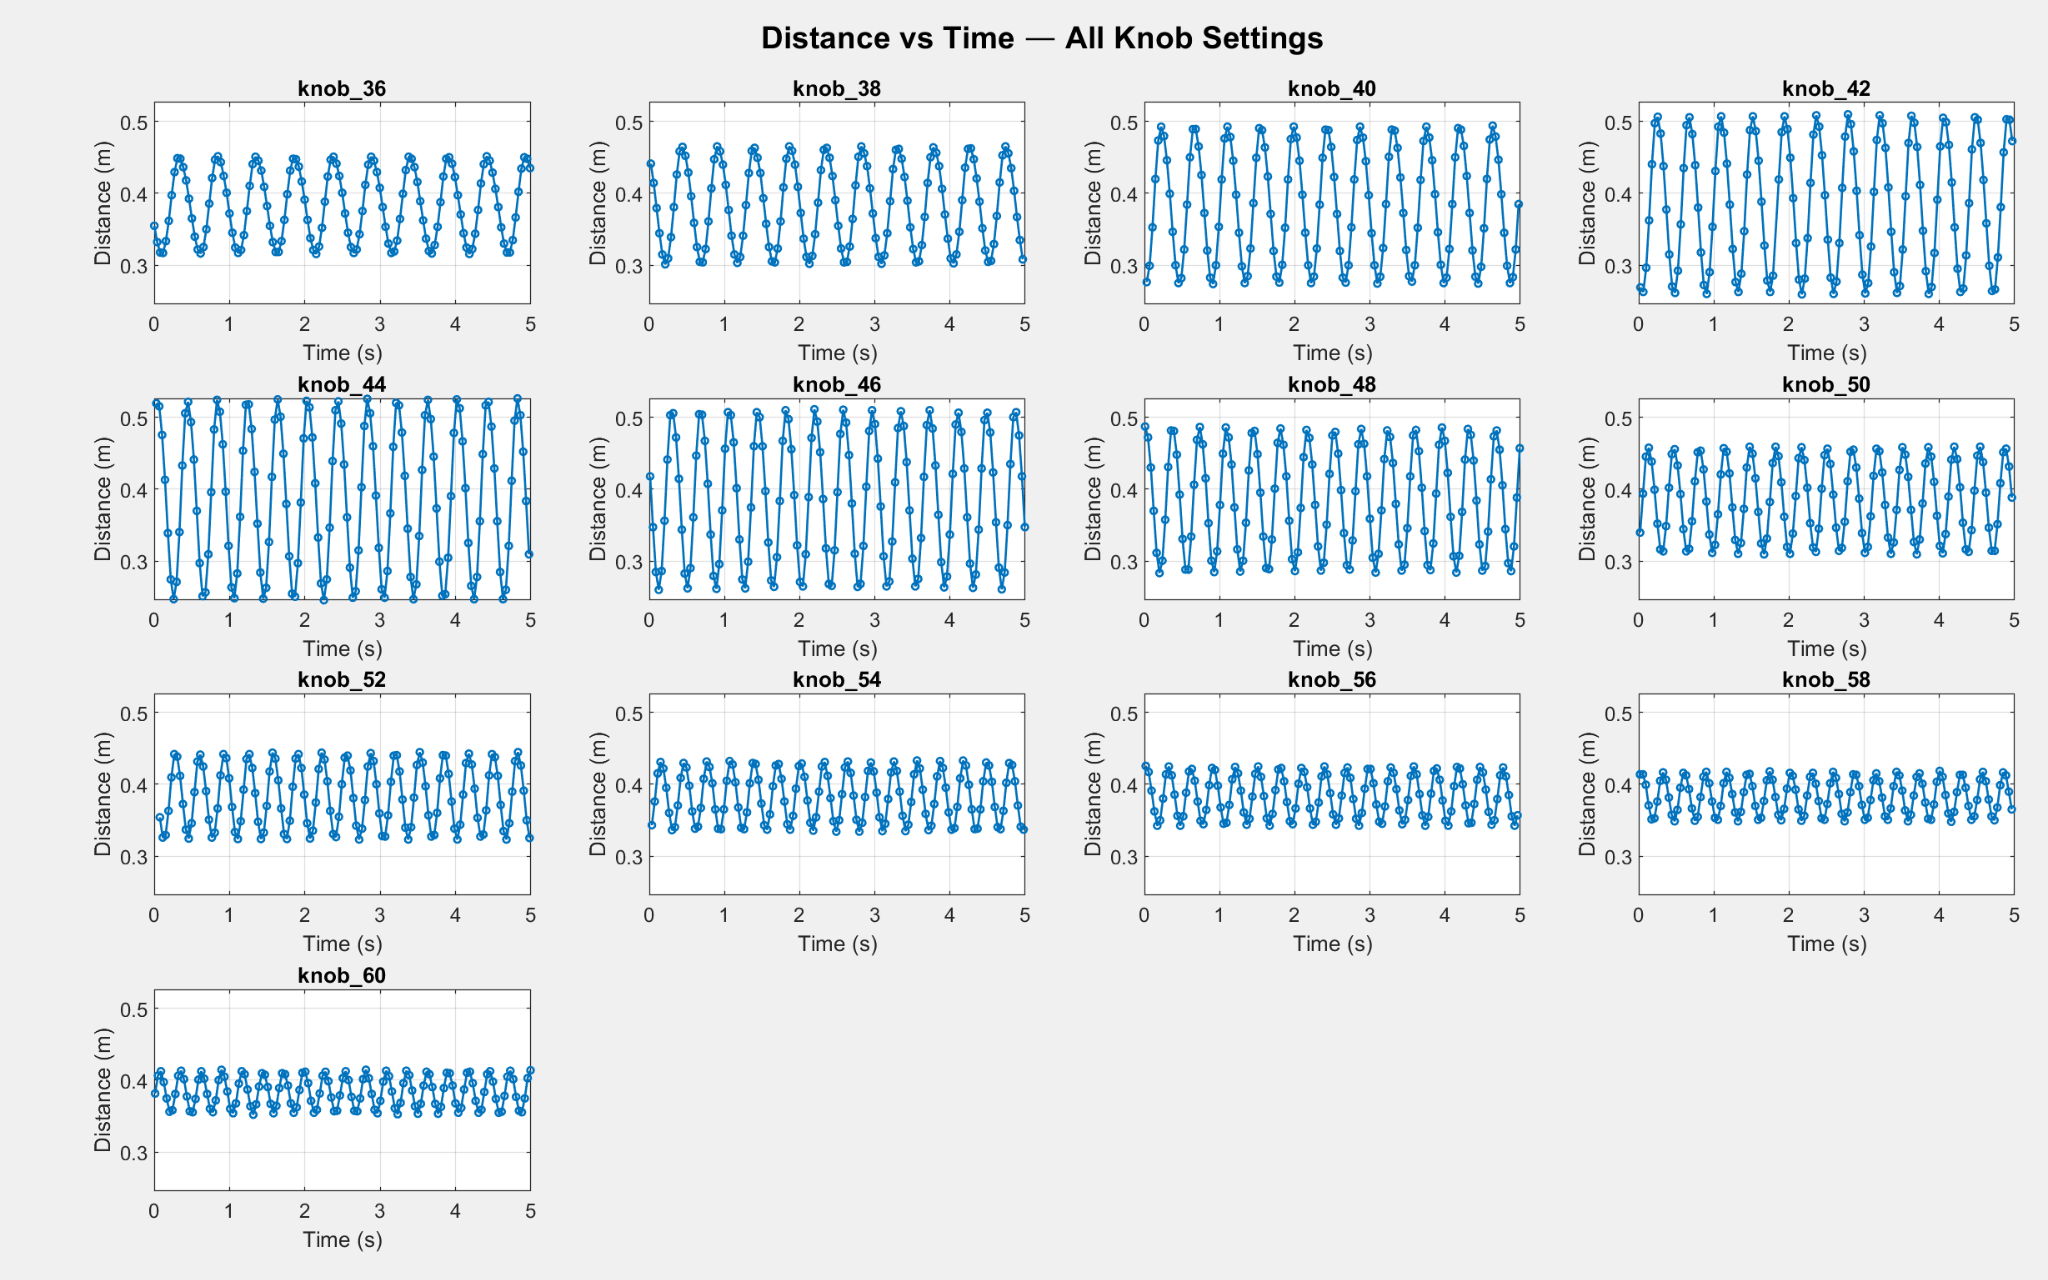
With those numbers settled, we ran the real sweep: 13 motor speeds from knob 36 to knob 60, roughly 2 to 3.7 Hz, recording the collar's motion at each. We did it twice, once working the speed up and once working it back down, to see whether the system behaved the same in both directions. The swing grows as the shake speed climbs toward the natural frequency, spikes at knob 44, then shrinks again once the shaking gets too fast for the collar to keep up. Classic resonance.
Results
Matching the textbook model
The payoff is one plot. For every shake speed we took the magnitude ratio, how far the collar moved divided by how far the base moved, and plotted it against speed for both sweeps. Then we drew the textbook prediction on top, using the natural frequency and damping we had measured (15.9 rad/s and ζ = 0.107). The measurements land right on the predicted curve. The collar's biggest swing was 0.2745 m on the way up and 0.2759 m on the way down, a gap under 0.6 percent and well inside our error bars. Off resonance the two sweeps parted by a hair, the fingerprint of the spring's slight stiffening and a little bearing friction, both of which any real rig has.
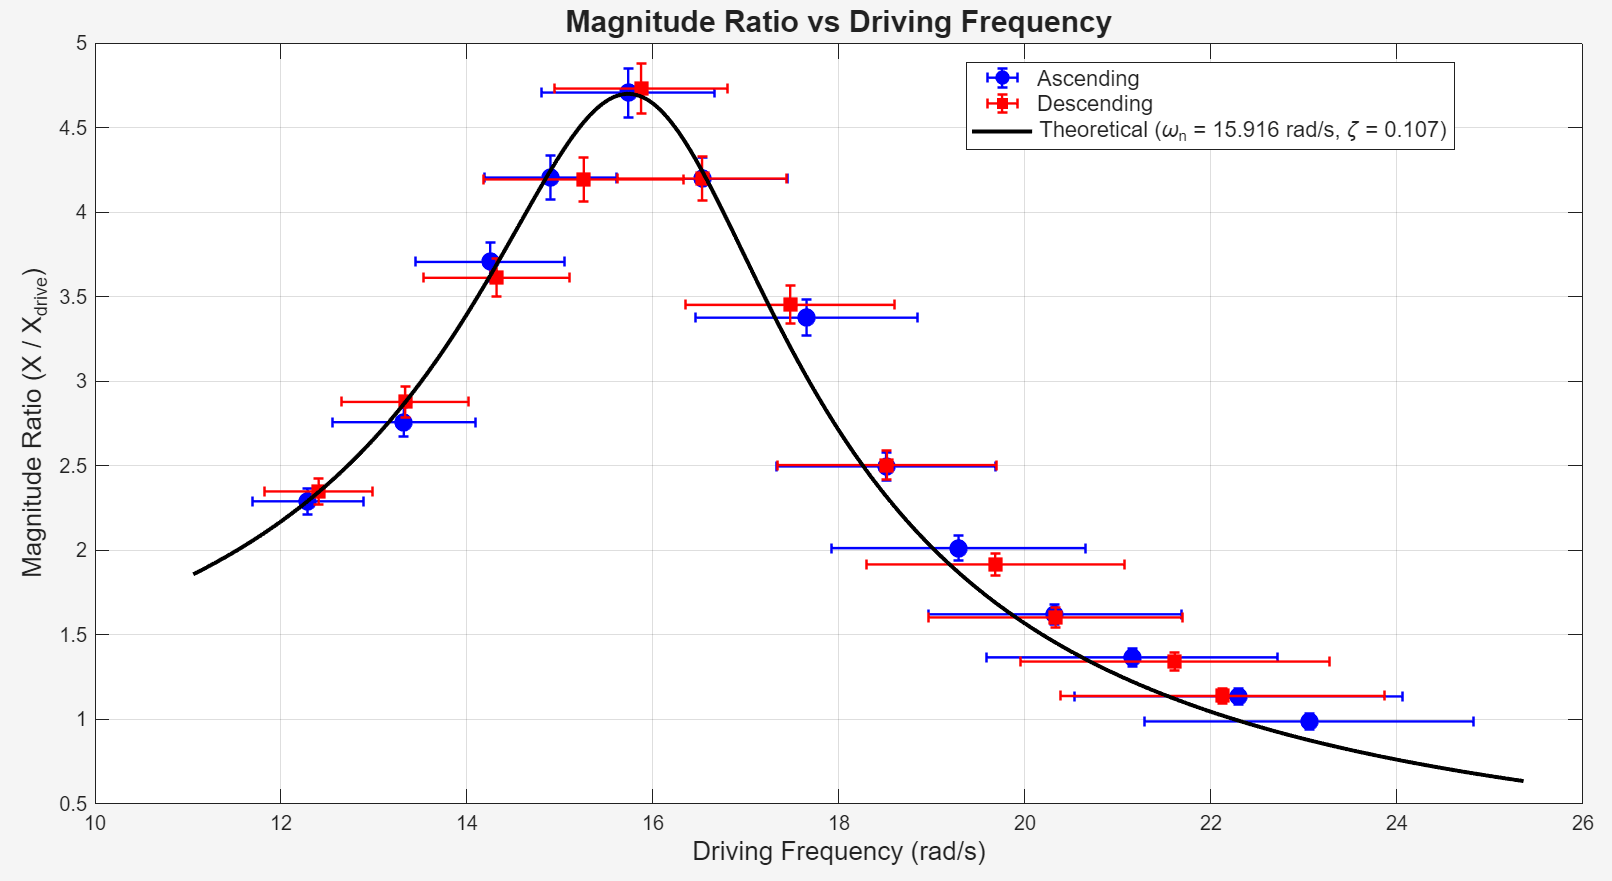
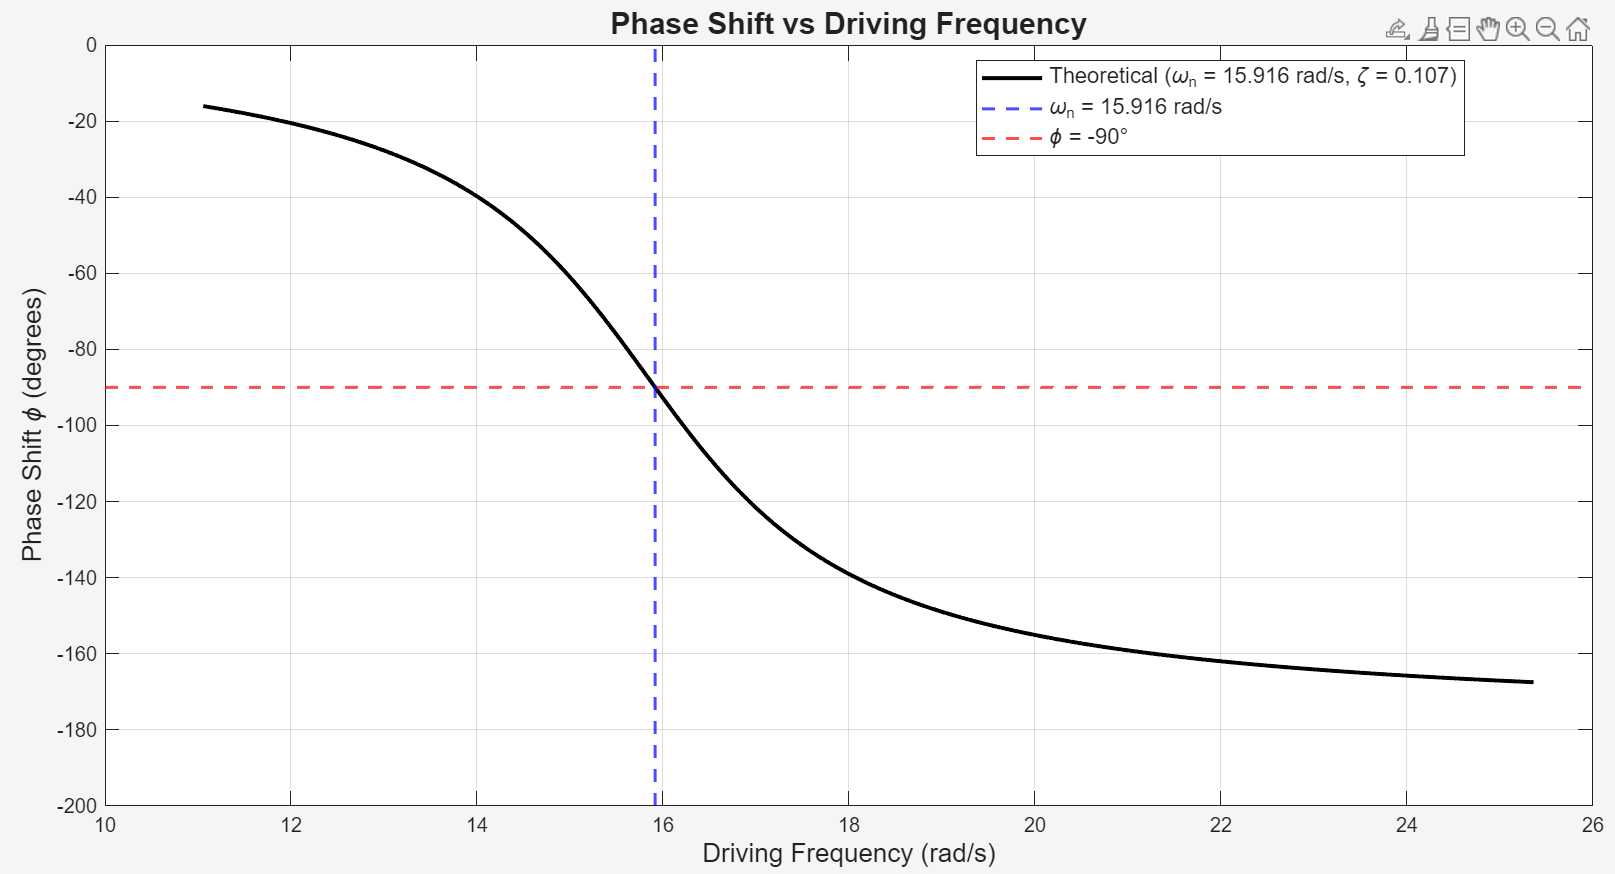
Left: the measured magnitude ratio for both sweep directions, against the textbook curve. Right: the phase lag, how far the collar's motion trails the base's, passes through 90 degrees right at the natural frequency.
The ultrasonic sensor carried the whole measurement on its own. Three things keep it honest: aim it square at the collar; sample fast enough to stay ahead of its 25 Hz pulse rate, so the readings don't alias into a false slower wave; and remember that the speed of sound drifts with room temperature, carrying every distance with it.
Project Image